
Attribute chart: c chart is also known as the control chart for defects (counting of the number of defects). It is generally used to monitor the number of defects in constant size units. There may be a single type of defect or several different types, but the c chart tracks the total number of defects in each unit and it assumes the underlying data approximate the Poisson distribution. The unit may be a single item or a specified section of items—for example, scratches on plated metal, number of insufficient soldering in a printed circuit board.
c chart takes into account the number of defects in each defective unit or in a given sample. While p chart analyzes the proportions of non-conforming or defective items in a process.
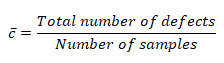
c chart, the number of defects is plotting on the y-axis and the number of units on the x-axis. The centerline of the c chart (c̅) is the total number of defects divided by the number of samples.
The control chart is a graph used to study how process changes over time. A control chart always has a central line for average, an upper line for upper control limit, and lower line for the lower control limit. The control limits are ±3σ from the centerline.
Selection of appropriate control chart is very important in control charts mapping, otherwise ended up with inaccurate control limits for the data.
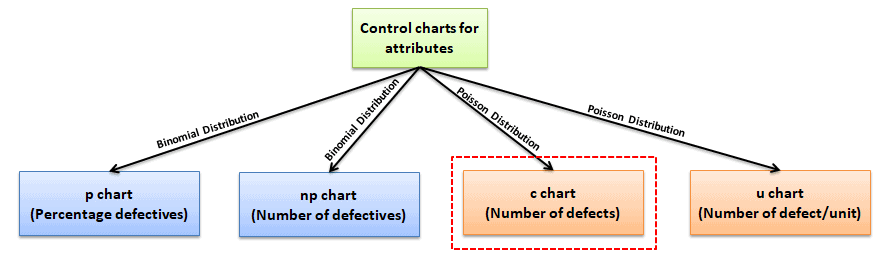
X̅ and R chart are used for measurable quantities such as length, weight height. Attribute control charts are used for attribute data. In other words, the data that counts the number of defective items or the number of defects per unit. For example number of tubes failed on a shop floor. Unlike variable charts, only one chart is plotted for attributes.

The c chart is one of the quality control charts used to track the number of defects in a product of constant size, while u chart is used for a varying size.
A c-chart is used to determine if the process is stable and predictable and also to monitor the effects of before and after process improvements. c chart is especially used when there are high opportunities for defects in the subgroup, but the actual number of defects is less.
The c chart requires that each subgroup’s sample size be the same and compute control limits based on the Poisson distribution.
Four types of control charts exist for attribute data. p chart plots the proportion of defective items, and np chart is for the number of defectives. u chart is for the average number of defects per unit and c chart is for the number of defects.

Example: Mobile charger supplier drawn randomly constant sample size of 500 chargers every day for quality control test. Defects in each charger are recorded during testing. Based on the given data, draw the appropriate control chart and comment on the state of control.
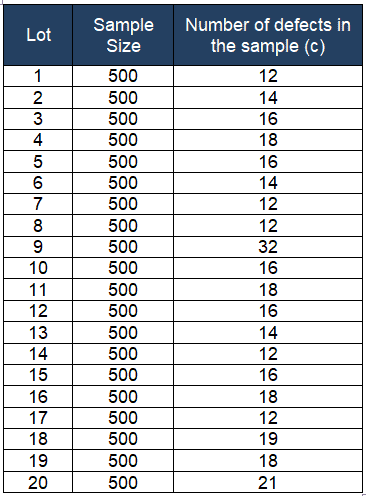
Compute c̅ = total number of defects / total number of lots =Σc/k =326/20= 16.3
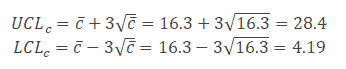
Then calculate upper control limit (UCL) and low control limit (LCL)
Plot the graph with number of defects on the y-axis, lots on the x-axis and also draw center line (c̅), UCL and LCL.

Interpret the chart: If any of the points in the chart is outside of ± 3σ limit, then consider the process is out of control. In the above example, the average number of defects per lot is 16.3. Sample 9 is outside of the control limit. Hence the process is out of control. Thus team needs to identify the root cause for the special cause variation.
To unlock additional content, please upgrade now to a full membership.
Upgrade to a Full Membership
If you are a member, you can log in here.